AI Data Analytics Agents: How to Automate Excel Reports with Python
-
- by Fiaz Ahmad
- June 16, 2026
- in AI Business Solutions, AI for Developers

Every data team knows the drill. Someone rebuilds the same Excel report every Monday morning. They pull numbers from three different sources, clean the data by hand, reformat columns, fix broken formulas, and send the file down the same distribution list. Forty-five minutes, every single week, without fail. In 2026, ai data analytics agents are eliminating that entire workflow, not just trimming a few minutes off it. This article breaks down how they work, how to build a Python-based agent pipeline that generates formatted Excel reports on autopilot, and what the real business impact looks like when organizations get this right.
What Are AI Data Analytics Agents
AI data analytics agents are autonomous software programs that plan multi-step analytical tasks, execute them using tools, evaluate their own outputs, and keep iterating without waiting for a human to approve each step. The key difference from standard Python scripts comes down to one thing: a script follows a fixed sequence of instructions, while an agent decides dynamically which steps to take based on its goal and whatever state the data happens to be in.
In a reporting context, that distinction matters more than it might seem. A script that reads a sales spreadsheet and generates a summary table will break the moment column names change or the source file shifts format. An ai data analytics agent reading the same file can detect the schema, adapt its approach, flag anomalies, and still produce the formatted output. That adaptability is what makes these systems genuinely useful in the messy, unpredictable data environments most businesses actually deal with day to day.
The technical foundation for most production agent systems today combines three layers: a large language model for reasoning and natural language instruction parsing, a set of callable tools (pandas for data transformation, openpyxl for Excel formatting, file system access for reading source data), and an orchestration framework that manages state, memory, and tool execution sequences. LangChain and LangGraph are the two most widely adopted Python frameworks for this architecture heading into 2026.
Key Statistics: The Business Case for AI Data Analytics Agents
The adoption numbers for ai data analytics agents in analytics workflows tell a pretty clear story. Data teams are seeing up to 80% reduction in data preparation time after deployment, which directly accelerates the broader analytics pipeline. That is not a marginal efficiency win. It is the difference between a team that spends most of the week cleaning data and one that actually has time to analyze it.
Across enterprises, 66% of companies using AI agents have seen measurable productivity gains, and 40% of enterprise applications are expected to include AI agents by the end of 2026, up from under 5% in 2025. Companies are now reporting 50 to 70 percent cuts in analysis time after implementing AI agents for data analysis workflows.
The global AI agents market is hitting $10.91 billion in 2026, up from $7.63 billion in 2025, a nearly 43% jump in a single year. That growth is being driven substantially by data and analytics use cases, where the ROI on automation is measurable, repeatable, and easy to document. Companies investing in AI agents are reporting an average ROI of 3.5x, with top performers reaching over 8x returns.
The Python Stack Behind AI Data Analytics Agents
Building an effective ai data analytics agent workflow in Python means assembling the right libraries for each function in the pipeline. The architecture that has emerged as the production standard combines four components working together.
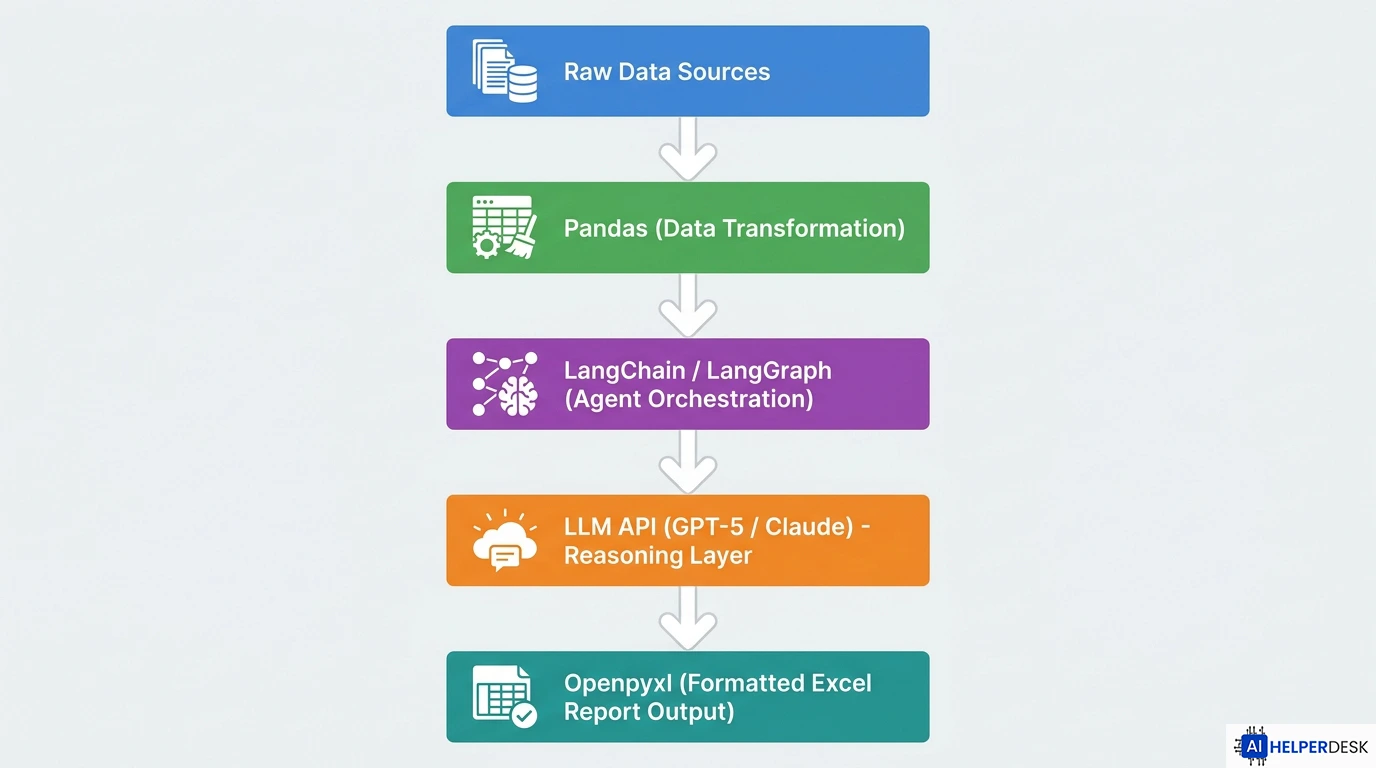
Pandas handles data ingestion and transformation. It reads from Excel, CSV, and database connections, normalizes column types, applies filters and aggregations, and outputs clean DataFrames the rest of the pipeline can use. Pandas remains the cornerstone of Python data work in 2026, and most agent frameworks treat it as the default tool for structured data manipulation.
Openpyxl handles formatted Excel output. While pandas is excellent for working with data, it does not give you deep control over Excel formatting features like cell colors, font styles, or charts. Openpyxl lets you create, read, and modify Excel files at a granular level, enabling automated reports that are not just accurate but actually look good and are easy to read.
LangChain or LangGraph provides the agent orchestration layer. LangChain is a high-level tool built on LangGraph, which provides a low-level framework for orchestrating the agent and runtime. If you are just getting started or only need a simple agent, LangChain is the easier path. LangGraph is better suited for more advanced use cases that require fine-grained state management and checkpoint-backed execution.
An LLM API, typically OpenAI’s GPT-5 family or Anthropic’s Claude, provides the reasoning layer that lets the agent interpret plain-language instructions, handle ambiguity in source data, and generate human-readable summaries alongside the formatted spreadsheet output.
Python AI Agent Workflow: Step-by-Step Report Automation
A practical python ai agent workflow for Excel report automation runs through a sequence of discrete stages. Understanding each one helps any team figure out where automation actually adds the most value in their specific context.
Stage 1: Data Ingestion
The agent receives a goal in plain language, something like “read this month’s sales data from the uploads folder, calculate revenue by region, and produce a formatted summary report.” It identifies the source files, reads them into pandas DataFrames, and runs an initial schema inspection. At this stage, the ai data analytics agent can catch missing columns, inconsistent data types, and empty rows that would cause a standard script to either crash or silently produce wrong output.
Stage 2: Transformation and Analysis
The agent applies the required transformations using pandas: grouping, aggregation, filtering, and pivot operations. For pivot table generation, the agent uses pandas’ pivot_table functionality to process data and output a multi-worksheet Excel file via openpyxl, with separate worksheets for summary tables and raw data. The LLM layer handles edge cases where the transformation logic is ambiguous or where the data requires contextual judgment a fixed script simply cannot provide.
Stage 3: Formatted Output Generation
Once the analysis is done, the agent uses openpyxl to produce the final report. This includes applying header formatting with corporate color schemes, adding conditional formatting to highlight values above or below thresholds, embedding charts where needed, and structuring the file with named worksheets. AI data analytics agents flag discrepancies between systems, and the final report generates automatically with accurate figures, correct formatting, and zero manual touch-up. What used to take two full days now takes about 20 minutes.
Stage 4: Validation and Delivery
A well-designed agent pipeline includes a validation step before the report goes anywhere. The agent checks that all expected sections are present, that totals reconcile against source data, and that no cells contain error values. Only after clearing these checks does the agent write the final file to the output directory or trigger an email delivery through a connected API.
This multi-stage approach to autonomous agents in ai reporting is what separates a production-grade system from a glorified automation script. Each stage has its own failure modes and its own feedback loop, which lets the agent surface issues at the right point rather than letting problems quietly propagate through the entire pipeline.
Real-World Use Cases for Business AI Agents in Reporting
The most convincing evidence for ai data analytics agents comes from specific business contexts where time savings and accuracy improvements are directly measurable.
Finance Teams: Month-End Reconciliation
Finance teams reconciling data from ERP systems, bank feeds, and internal tracking sheets at month-end are now using Python scripts to merge all sources into a single workbook. AI agents flag discrepancies between systems. The final report generates automatically with accurate figures, correct formatting, and zero manual touch-up. For a mid-sized organization, this replaces a two-day manual process with a 20-minute automated run.
Supply Chain and Inventory
Warehouse teams tracking inventory across dozens of locations in separate Excel files are now running Python scripts to consolidate everything nightly. An ai data analytics agent compares current stock against reorder thresholds and historical demand patterns, highlights variance items with a risk classification (critical, monitor, or stable), and procurement teams see actionable output every morning without touching a single spreadsheet by hand.
Sales Reporting Pipelines
Business ai agents applied to sales reporting can pull CRM data, calculate pipeline velocity by sales representative, generate regional performance breakdowns, and produce a formatted executive summary, all in a single automated run. Teams that used to spend Friday afternoons assembling these reports now receive them automatically each morning. And quality is consistent because the agent applies the same logic every single time.
This connects naturally to the broader push for operational efficiency. If your team is already exploring ways to cut startup costs with AI, automating your reporting pipeline is one of the highest-leverage moves you can make, since it eliminates recurring labor costs while simultaneously improving output quality.
HR and Payroll Reporting
HR departments that process payroll data combining timesheets, approved leave, overtime records, and benefit deductions are now routing all of it through ai data analytics agent pipelines that validate inputs, calculate final figures, and produce formatted output reports ready for review. The agent handles the mechanical combination and calculation work while human reviewers stay focused on exception handling and final sign-off.
Benefits of AI Data Analytics Agents for Business Reporting
The business case for deploying ai data analytics agents in reporting workflows rests on four measurable categories of value.
Time recovery is the most immediate. Manual report assembly is almost entirely eliminatable for standard recurring reports. The hours recovered per team per week compound significantly over a quarter or a year.
Accuracy improvement follows directly from removing manual data handling. Every copy-paste operation, every manual formula entry, and every manual formatting step is a potential error point. Agent-generated reports apply the same logic identically every time, which means fewer surprises in your numbers.
Scalability is the third benefit. A human analyst can comfortably maintain three or four recurring reports. An agent can maintain thirty with the same effort, because the marginal cost of each additional report is just configuration time, not ongoing labor.
Analytical depth is the fourth. Because ai data analytics agents handle the mechanical assembly work, analysts can focus their attention on interpreting results and making recommendations rather than building the tables that hold the numbers in the first place.
Risks, Challenges, and Limitations
An honest picture of ai data analytics agents has to include the real failure modes that any implementation plan needs to address upfront.
Data quality remains the biggest blocker. 52% of organizations cite data quality as the primary obstacle to AI agent deployment. An agent working with inconsistent source data will produce inconsistent output, and unlike a human analyst who might notice something looks off, an agent will execute its pipeline confidently even when the inputs are corrupted. Upstream data quality controls are not optional. They are a prerequisite for any analytics agent deployment.
Hallucination risk is real, particularly in any agent step that involves generating narrative summaries or interpreting trends in plain language. A language model generating an executive summary might state a conclusion that is not strictly supported by the underlying numbers. Human review of narrative outputs before distribution is a necessary guardrail in any production reporting system.
Governance gaps tend to drive failure at the organizational level. IDC found that 88% of AI proofs-of-concept never reach widescale deployment, and only about 23% of organizations report significant ROI from AI agents. Most failures are architectural, not model-related. Teams that deploy agent pipelines without defined ownership, monitoring, and a clear escalation path when something breaks will eventually find the system producing wrong numbers that nobody catches in time.
Security considerations apply wherever agents have access to sensitive financial or personnel data. Permissions should follow the principle of least access. An ai data analytics agent generating a sales report has no business with write access to the underlying CRM database.
Expert Analysis
The 2026 landscape for ai data analytics agents in Excel reporting presents a clear strategic opportunity, but the performance gap between organizations getting this right and those getting it wrong is wide.
The technical foundation is solid. The combination of pandas, openpyxl, and a LangGraph orchestration layer can handle most recurring reporting workflows that enterprise data teams currently run manually. The LLM reasoning layer adds the adaptability that makes these systems genuinely robust in production environments where source data changes without notice.
What the statistics reveal, though, is that technical capability is not the limiting factor. The companies that will pull ahead through this cycle are not the ones moving fastest. They are the ones moving most deliberately, with production-grade governance, scoped pilots with clear ROI metrics, and vertical AI agents built for specific use cases rather than general-purpose automation.
For data teams evaluating where to start, the highest-value entry point is a single high-frequency report that currently consumes significant manual effort and has a well-defined, stable output format. That scoped deployment generates the organizational learning, the governance model, and the internal confidence needed to expand. Teams that try to automate twenty reports at once typically end up with twenty fragile pipelines and no clear owner for any of them.
The long-term differentiation in business analytics will not come from simply having ai data analytics agents. Most organizations will have them within two years. The differentiation will come from how deeply those agent pipelines are integrated with upstream data systems, how quickly they surface actionable signals rather than just formatted summaries, and how well the organization has built the human review layer that catches failure modes before they affect real decisions.
Future Outlook
The trajectory for ai data analytics agents in enterprise reporting points clearly toward deeper integration and broader autonomy over the next 24 to 36 months. Organizations that have already deployed ai data analytics agents in pilot programs are now scaling those systems to cover entire reporting functions.
Multi-agent architectures will replace single-agent pipelines in complex reporting environments. Rather than one agent handling data ingestion, transformation, formatting, and delivery sequentially, organizations will deploy specialist agents for each function, coordinated by an orchestrator that manages dependencies and handles failures in individual components without stopping the entire pipeline. This mirrors the approach already emerging in autonomous agents in ai deployments across other business functions.
Real-time reporting will become the standard expectation. Agents connected to live data streams through API integrations will produce updated reports on a trigger basis rather than a scheduled one, meaning executives will be looking at current data rather than yesterday’s snapshot whenever they pull up a dashboard.
LangGraph has become the production backbone for advanced AI agent systems in 2026, with major enterprises including Klarna, LinkedIn, and Uber running agent workflows on the framework at scale. That ecosystem maturity means the Python tooling for building production-grade analytics agent pipelines is now robust enough for any organization to adopt without needing to build foundational infrastructure from scratch.
By 2028, Deloitte projects that 74% of organizations will be using agentic AI at least moderately, up from 23% today. For data and reporting teams, the question is no longer whether to adopt ai data analytics agents, but how to sequence that adoption to maximize return and minimize disruption.
Conclusion
The case for ai data analytics agents in Excel reporting is well past the theoretical stage at this point. The tools are mature, the frameworks are production-ready, and the business outcomes are documented across finance, supply chain, sales, and HR teams that have made the shift from manual assembly to automated pipelines. The Python stack combining pandas, openpyxl, and LangGraph gives any data team a clear implementation path, and the statistics on time savings and ROI provide a solid foundation for the internal business case.
The teams that will benefit most are those that start with a single scoped report, build the governance model alongside the technical pipeline, and expand from a stable foundation. AI data analytics agents do not eliminate the need for analytical expertise. They redirect it from mechanical work to meaningful work, and that is a shift most data professionals have been waiting a long time for.
Frequently Asked Questions
AI data analytics agents are autonomous programs that reason about goals, decide which tools to use, and iterate based on results without step-by-step human direction. Regular Python scripts follow a fixed sequence and break when inputs change. An agent adapts dynamically, making it far more reliable in real business environments where data is inconsistent or unpredictable.
The core stack combines pandas for data transformation, openpyxl for formatted Excel output, and LangChain or LangGraph for agent orchestration. An LLM API such as GPT-5 or Claude provides the reasoning layer. These four components cover the full pipeline from raw data ingestion to professional report delivery.
A basic python ai agent workflow for a single recurring report can be built in two to four weeks by a developer with solid Python and pandas experience. The setup involves configuring the data ingestion, writing transformation logic, defining the output format in openpyxl, and wiring up the LangChain or LangGraph orchestration layer.
Companies investing in AI agents report an average ROI of 3.5x, with top performers exceeding 8x. For reporting workflows specifically, the payback period tends to be short because the labor cost of manual report generation is easy to quantify. Data teams report up to 80% reduction in data preparation time after implementation.
The top risks are data quality issues (52% of organizations cite this as the primary blocker), hallucination in narrative summaries generated by the LLM layer, governance gaps that leave pipelines without clear ownership, and security exposure from agents with overly broad data access permissions. All four risks are manageable with proper system design and a scoped rollout approach.
No. AI data analytics agents automate the mechanical work of data preparation, report assembly, and formatting. They do not replace the human judgment needed to interpret findings, identify strategic implications, or make decisions based on data. The most effective deployments free analysts from repetitive work so they can focus on higher-value analytical thinking.